Admin Operations
Authentication is not done when login works. It is done when someone can watch it work — see
the OTP funnel, spot the provider that started failing at 3am, and answer “who stepped up to
approve that payout?” without grepping logs. That is what Admin Operations is for.
Laravel Rebel ships two cooperating packages for running the suite in production:
laravel-rebel-admin-api— a headless JSON control plane. It exposes read models over the
data that-corealready records inrebel_auth_events: security metrics, an audit-event
explorer, OTP and step-up funnels, and provider health.laravel-rebel-admin— a web Admin Panel (a security operations / SOC dashboard) built on
Blade + AJAX + vanilla JavaScript, with no mandatory front-end framework. It consumes the Admin
API and renders it for humans.
The web panel works without ai-guard. Anomaly detection is an optional layer — if you install
it, anomalies surface in the panel; if you don’t, every other view still works. See
AI Guard.
The two layers
The Admin API is the single source of truth. The web panel is one consumer of it; your own
incident tooling can be another. Everything both of them show traces back to events the core audit
trail recorded — there is no separate, divergent operations database.
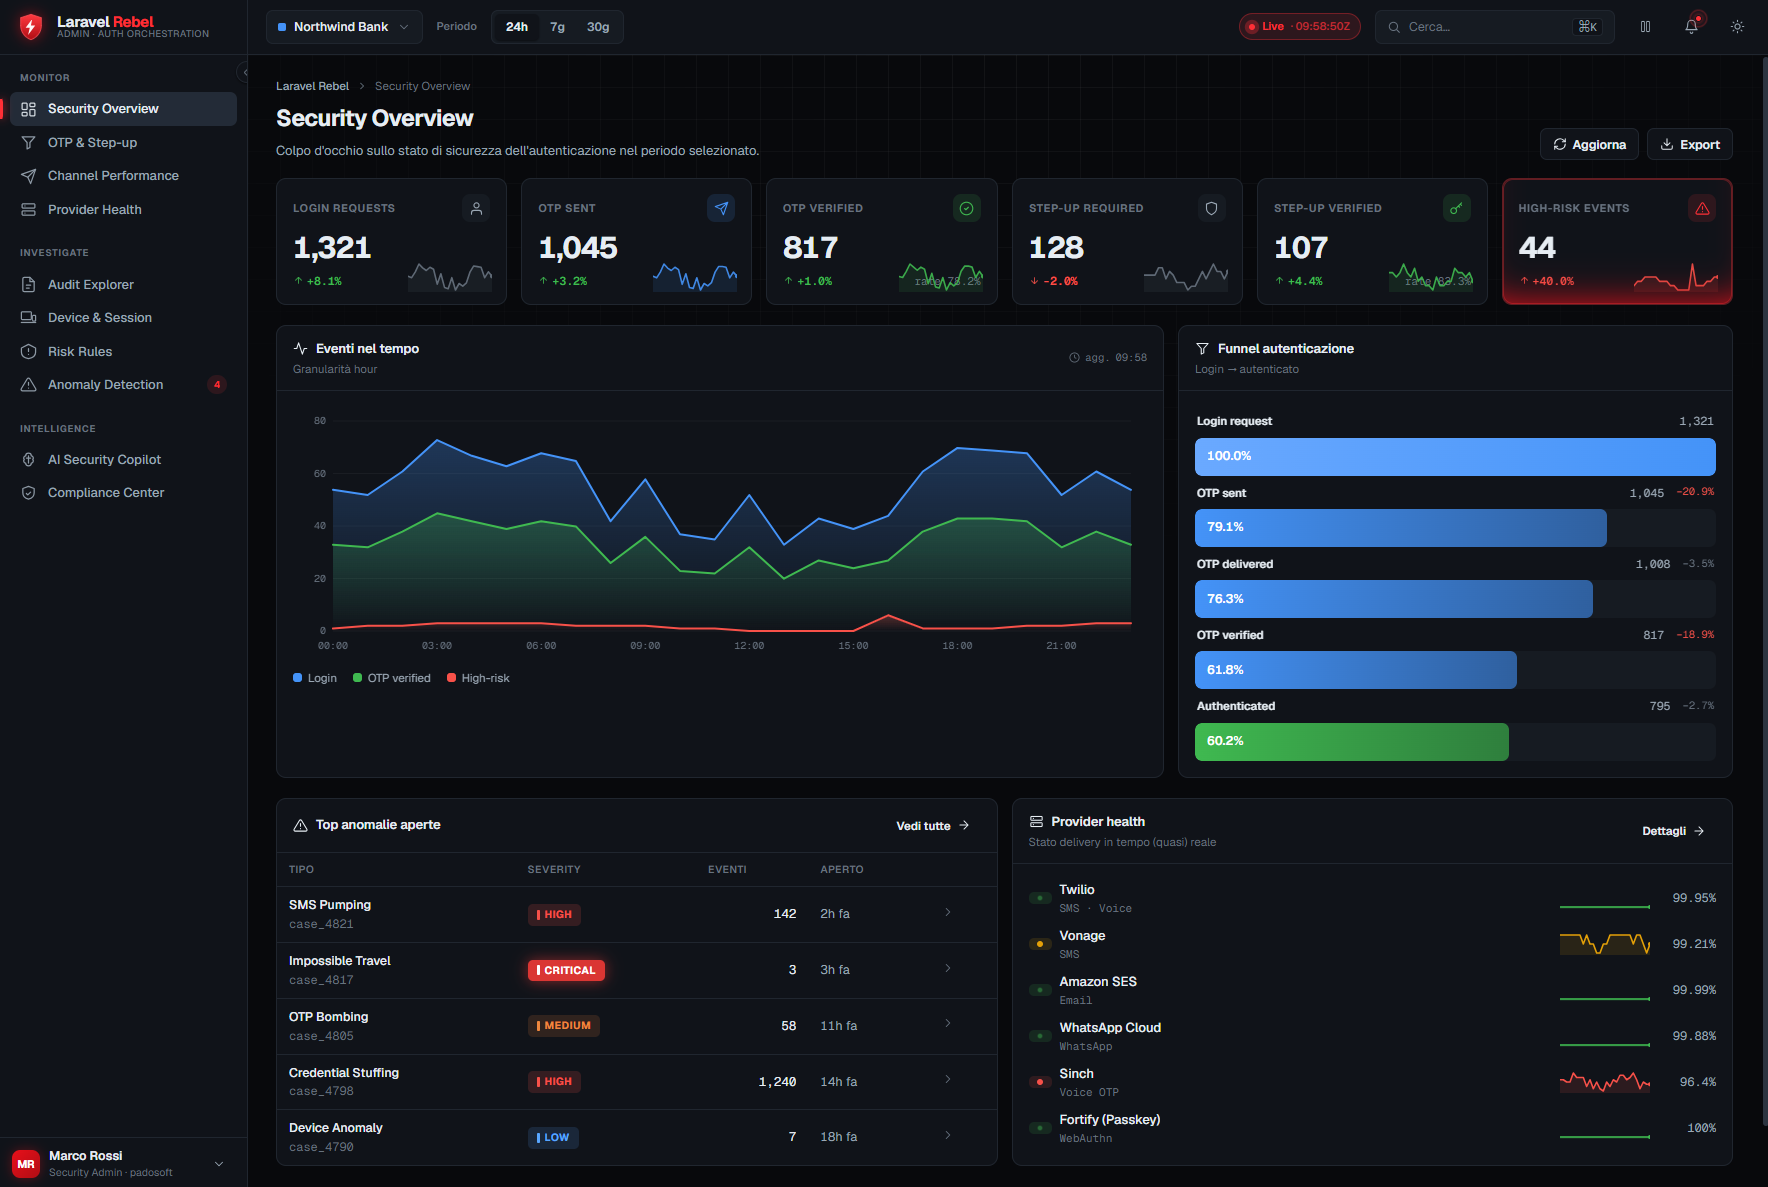
What the SOC dashboard gives you
Logins, OTP verifications, step-up approvals, failures and active sessions at a glance, over a time
window. The honest empty state shows zero, never invented data.
Browse and filter rebel_auth_events: by event type, guard, purpose, assurance level, tenant and
time. Identifiers stay keyed HMACs — you investigate without reading PII in cleartext.
Where do users drop? Challenge issued → delivered → verified for OTP; requested → satisfied for
step-up. Drop-off is where fraud and friction both hide.
Send success, delivery receipts, cost and country per channel provider. A provider degrading is an
operational event, not a mystery in a log file.
Permission-gating and tenant scoping
Both layers are read-only over security data, but “read-only” is not “open.”
Panel access is gated. The web panel sits behind the
EnsurePanelAccessmiddleware. A user
who can authenticate to your app is not automatically allowed into the SOC dashboard — panel
access is a separate authorization decision.API endpoints are permission-gated. Every Admin API read model checks the caller’s
permissions. Metrics, the audit explorer and provider health are distinct capabilities, so you
can hand an analyst the explorer without handing them everything.Reads are tenant-scoped. In a multi-tenant deployment, an operator sees their tenant’s events
and metrics — not the whole table. The read models build on the coreTenantContext/
CurrentTenantso scoping is enforced at the query layer, not patched on in the view.
Cross-tenant visibility is a deliberate, privileged capability — not a default. If you need a
platform-wide view for support, that is an explicit elevated permission, and the access itself is a
security-significant event worth auditing. Do not widen the default scope to “see everything.”
The rebel:project-metrics command
For dashboards you don’t sit in front of — CI gates, nightly reports, a status page feed — the
Admin API ships a real Artisan command:
php artisan rebel:project-metrics
It produces the same overview metrics the panel renders, from the command line. Wire it into a
scheduled job to push a daily security digest, or run it in a pipeline to assert that, say, the OTP
verification rate has not collapsed since the last deploy.
Because the command reads the same rebel_auth_events data through the same read models, its
numbers always agree with the web panel. There is no second pipeline to keep in sync.
A day in operations
Morning glance. Open the dashboard, scan the overview KPIs against yesterday. A sudden dip in
the OTP funnel’s delivered step points at a channel provider, not at your app.Confirm with provider health. The provider-health view shows one SMS provider’s delivery
receipts dropping in a single country. You fail traffic over to the fallback provider (see
Channels & Fallback).Investigate a flagged event. The audit explorer surfaces a burst of failed step-up attempts
for one purpose. You filter by purpose and tenant, read the (keyed, non-PII) trail, and decide
whether it’s an attack or a broken integration.Report. A scheduled
rebel:project-metricsrun has already posted the night’s numbers to
your status channel. Nothing here is hand-collected, so nothing drifts.
Related
- Package reference: admin · admin-api
- The optional anomaly layer: AI Guard
- Where the data comes from: the core audit trail
- See it end to end: Worked Example
